Any sufficiently advanced technology is indistinguishable from
magic.
– Arthur C. Clarke
Goal: provide a concise walk-through of all fundamental neural
network (including modern deep learning) techniques.
I will not discuss every possible analogy, angle, or topic here.
Instead, I will provide links to external resources so that you can
choose which topics you want to investigate more closely. I will provide
minimal code examples when appropriate.
Useful prior knowledge:
matrix calculus
programming skills
familiarity with computing tools
1.1
Background
Artificial neurons date back to the 1940s and neural networks to the
1980s. These are not new techniques, but we surprisingly still have a
lot to learn about how they work and how to best create them. Research
into neural networks accelerated in the late 2000s as we found ourselves
with more data and more compute power.
Neural networks (NN) are a type of machine learning (ML) technique.
ML falls under the artificial intelligence (AI) umbrella. AI is a broad
area, and it doesn’t hurt to think of it as including any system that
appears to do something useful or complex.
You’ll find that techniques often start out as AI, but then we remove
that label after we start to better understand them. ML is just one type
of AI, and it comprises all techniques that automatically learn from
data. NNs learn from data, and specifically they do so using very little
input from the designer.
NNs are a subset of ML, which is a subset
of AI.
All of this is a bit vague, so let’s discuss some specific
applications. Maybe we want a NN to:
Tell us if an Amazon review is positive or negative based on text
alone.
Tell us if an image contains a cat or a dog.
Translate an English sentence to German.
Tell us where in an image we can find a boat.
Automatically generate a caption for an image.
Direct a robot around a building.
Play a board game or a video game.
Tell us about the orientation of a persons limb’s for a virtual
reality game.
Prevent an autonomous car from driving off the road.
Group together all users of a social network that are likely to
listen to the same music.
Create a new piece of art.
Predict the sale price of a house.
Predict the future sale price of an investment.
Suggest products to purchase or movies to watch.
Diagnose an injury from an X-ray CT scan.
Automatically summarize a news article.
Label a news article as fake or real.
This is just a small subset of what we could do. Nearly all
applications have the same basic flow:
General flow of data in a
NN.
The core of the NN is the ability to take and input, perform some
mathematical computations, and then produce the output. The “learning”
part includes comparing the output to a known-to-be-correct output (aka
the “label” or “target”) and then using this comparison to iteratively
improve the NN.
This setup, where we know the correct output, is known as “supervised
learning.” Later parts of this guide will touch on “unsupervised
learning” and “reinforcement learning,” but it is safe to say that most
ML applications are in the area of supervised learning.
Question: What might be the input, output, label, and
criterion if we want an NN to distinguish between pictures of cats and
pictures of dogs?
Answer: The input would be an image, the output would
be a guess of cat or dog, the label would be the actual contents of the
image, and the criterion should have something to do with if the output
guess was correct or not.
A bit of the maker goes into that which they make.
– Unknown
How is ethics important to NN (and AI in general)? It can help us
answer questions such as:
What should we build?
What should we not build?
How should we build something?
Question: Who is in charge of enforcing ethics in AI?
Answer: Everyone and no one. We do not have a special
ethics force to guide us. The problem is clearly that if
everyone is responsible, nobody will think they need to act.
Question: When should you start to consider ethical
implications?
Answer: From the very beginning. This will make it
easier to:
avoid pitfalls,
analyze results from an ethical lens,
avoid wasting time, and
ensure the system is ethical.
Being ethical sounds like it should be easy, however we all come to
the table with our own value systems, opinions, motivations, and power.
What would you do if you were directed to build something you knew to be
unethical? How does your answer change if your choices are to build or
to quit?
2.1 Key
Topics
This is not going to be an exhaustive discussion on ethics in AI and
NNs. Instead, I’ll point you to the resources in the Additional Material section. The
topics below are taken from Ethics —
fastbook.
Topics to consider:
Recourse and accountability: who is responsible
(and liable) for the developed system? The user, developer, manager,
owner, company, other?
Feedback loops: does the system control creation of
the next round of input data (such as a video recommendation
system)?
Bias: all systems have bias; what bias is in your
system? Is the source of bias historical, from measurement, from
aggregation, from the representation, other?
Disinformation: can your system be used for
nefarious goals?
2.2
Strategies
Here are some questions you can ask to prevent running into
trouble:
General Questions:
Should we even be doing this?
What might be the accuracy of a simple non-ML alternative?
What processes will we use to handle appeals/mistakes?
How diverse is our team?
Data Questions:
Is our data valid for its intended use?
What bias could be in our data? (All data contains bias.)
How could we minimize bias in our data and model?
How should we “audit” our code and data?
Impact Questions:
Do we expect different errors rates for different sub-groups in the
data?
What are likely misinterpretations of the results and what can be
done to prevent those misinterpretations?
How might we impinge individuals’ privacy and/or anonymity?
When should you ask these questions? The Markkula Center for Applied
Ethics recommends scheduling regular meeting in which you perform
ethical risk sweeping. See their Ethical
Toolkit for more information.
Perhaps the most important aspect of a neural network is the dataset.
Let
\[\mathcal{D} = \{X, Y\}\]
denote a dataset comprising input features\(X\) and output targets\(Y\). Although \(X\) and \(Y\) can come in many shapes, I am going to
be opinionated here and use a specific (and consistent) convention.
Let’s use \(N\) to denote the size of
the paired dataset. (Note, not all problems have output targets, but
herein I am talking about supervised learning unless otherwise
specified.)
We will frequently take a dataset and split it into examples used for
training, validation, and evaluation. We’ll discuss these terms near the
end of this section.
\(X\) is a matrix (indicated by
capitalization) containing all features of all input examples. A single
input example \(\vx\i\) is often
represented as a column vector (indicated by boldface):
where subscripts denote the feature index, \(n_x\) is the number of features, and the
superscript \(i\) denotes that this is
the \(i^{\mathit{th}}\) training
example. We do not always put the input features into a column vector
(see sec. 9 for more information), but it is fairly standard.
Each row in \(X\) is a single input
example (also referred to as an instance or sample), and when you stack
all \(N\) examples on top of each other
(first transposing them into row vectors), you end up with:
We transpose each example column vector (i.e., \(\vx^{(i)T}\)) into a row vector so that the
first dimension of \(X\) corresponds to
the number of examples \(N\) and the
second dimension is the number of features \(n_x\). Compare the column vector above to
each row in the matrix.
Let’s denote matrix dimensions with \((r
\times c)\) (the number of rows \(r\) by the number of columns \(c\) in the matrix). I will, in text and in
code, refer to matrix dimensions as the “shape” of the matrix.
Question: What is the shape of \(X\)?
Answer: We say that \(\vx\i
\in \mathcal{R}^{n_x}\) (each input example is \(n_x\) real values) and \(X \in \mathcal{R}^{N \times n_x}\).
Therefore, the shape of \(X\) is \((N \times n_x)\).
\(Y\) contains the targets (also
referred to as labels or the true/correct/actual/expected output
values). Here is a single target column vector:
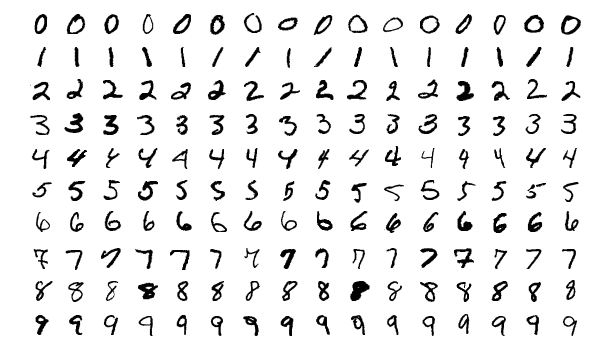
Let’s use the MNIST dataset as
an example. This dataset comprises a training partition including 60,000
images and a validation partition including 10,000 images. Each image is
28 pixels in height and 28 pixels in width for a total of 784 pixels.
Each image depicts a single handwritten digit—a number in the range zero
through nine). Here is a small sample of these images:
MNIST Sample. Image from
Wikipedia.Question: What is the shape of the training partition
of the input \(X_{train}\)?
Answer:\(X_{train}\)
is \((60000 \times 784\)): \[X =
\begin{bmatrix}
x^{(1)}_{1} & x^{(1)}_{2} & \cdots & x^{(1)}_{784} \\
x^{(2)}_{1} & x^{(2)}_{2} & \cdots & x^{(2)}_{784} \\
\vdots & \vdots & \ddots & \vdots \\
x^{(60000)}_{1} & x^{(60000)}_{2} & \cdots
& x^{(60000)}_{784}
\end{bmatrix}
\] The first row includes all 784 pixels of the first training
image, and subsequent rows likewise contain pixel data for a single
image.
Question: What is the shape of the training partition
of the targets \(Y_{train}\)?
Answer:\(Y_{train}\)
is \((60000 \times 10\)): \[Y =
\begin{bmatrix}
x^{(1)}_{1} & x^{(1)}_{2} & \cdots & x^{(1)}_{10} \\
x^{(2)}_{1} & x^{(2)}_{2} & \cdots & x^{(2)}_{10} \\
\vdots & \vdots & \ddots & \vdots \\
x^{(60000)}_{1} & x^{(60000)}_{2} & \cdots
& x^{(60000)}_{10}
\end{bmatrix}
\] Each row in this matrix is one-hot encoded, meaning that only
one item in each row is “1” and all other items in a row are “0”. Here
is an example of a one-hot encoding target for an input image
representing the digit “2” \[y^T =
\begin{bmatrix} 0 & 0 & 1 & 0 & 0 & 0 & 0 &
0 & 0 & 0\end{bmatrix}\] For efficiency sake, we often
represent a one-hot encoded vector using just the index of the “hot”
item. For example, the previous vector can be represented by the integer
2.
Question: What are the shapes of \(X_{valid}\) and \(Y_{valid}\)?
Answer:\(X_{valid}\)
and \(Y_{valid}\) are \((10000 \times 784)\) and \((10000 \times 10)\), respectively.
You might now wonder why we split a dataset into
training/validation/evaluation partitions. It is reasonable to think
that we would be better off using all 70000 images to train a neural
network. However, we need some method for measuring how well a
model is performing. That is the purpose of the validation set–to
measure performance.
If we measure performance directly on the training dataset, we might
trick ourselves into thinking that the neural network will perform very
well when it is eventually deployed as part of an application (for
example, as a mobile app in which we convert an image of someones’s
handwritten notes into a text document), when in reality the network
might only perform well specifically on the examples found in the
training dataset. We will discuss this issue more in sec. 8 when we
cover overfitting and generalization.
Similarly, the evaluation partition is only used to compare
performance after hyper-parameter tuning, which we’ll discuss in
sec. 12.
3.1
Loading MNIST Using PyTorch
We’ve discuss notation and general concepts, but how would we write
this out in code? Here is an example how how to load the MNIST dataset
using PyTorch.
1#!/usr/bin/env python 2 3fromtorch.utils.dataimportDataLoader 4fromtorchvision.datasetsimportMNIST 5fromtorchvision.transformsimportCompose,Normalize,ToTensor 6 7# Location in which to store downloaded data 8data_dir="../Data" 9 10# I used torch.std_mean to find the values given to Normalize 11# We will discuss normalization in section 4 12mnist_xforms=Compose([ToTensor(),Normalize((0.1307,),(0.3081,))]) 13 14# Load data files (training and validation partitions) 15train_data=MNIST(root=data_dir,train=True,download=True,transform=mnist_xforms) 16valid_data=MNIST(root=data_dir,train=False,download=True,transform=mnist_xforms) 17 18# Data loaders provide an easy interface for interactive with data 19train_loader=DataLoader(train_data,batch_size=len(train_data)) 20valid_loader=DataLoader(valid_data,batch_size=len(valid_data)) 21 22# This odd bit of code forces the train loader to give us all inputs and targets 23X_train, y_train=next(iter(train_loader)) 24X_valid, y_valid=next(iter(valid_loader)) 25 26# Let's start by simply printing out some basic information 27print("Training input shape :",X_train.shape) 28print("Training target shape :",y_train.shape) 29print("Validation input shape :",X_valid.shape) 30print("Validation target shape :",y_valid.shape)
This is slightly different than what we discussed. PyTorch expects us
to use this dataset with a convolutional neural network. When we get to
sec. 9 we’ll make more sense of this data format.
3.2
Similarity Digit Classifier
Before we get into training NNs, we will start with a non-ML
classifier. This will provide a nice comparison, and show that ML must
be learning something beyond simple comparisons.
Let’s try to solve the following problem:
Question: Given the MNIST dataset and also an image of
an unknown digit, how would you decide which digit is represented in the
unknown image?
Answer: One method would be to find an “average” image
for the ten separate digits, and then compare the unknown image to the
ten averages and assign the unknown label as that of the closest average
image.
For reference, here is what the “average” looks like for each of the
ten digits.
Average of the ten MNIST digits from the
training dataset.
Before we show a solution, however, we should take a guess at how
well a random guesser might perform.
Question: What percent of the time would you be correct
in guessing digits if you were guessing at random?
Answer: If you are equally likely to guess any of the
ten digits, then you would be right around 10% of the time \(\left(\frac{1}{10}\right)\). How might this
change if you were to always guess the same thing? How about if the
dataset has mostly ones and sevens?
And now some code for finding the most similar digit.
1#!/usr/bin/env python 2 3frommathimportinf 4frommatplotlibimportpyplotasplt 5 6importtorch 7fromtorch.utils.dataimportDataLoader 8fromtorchvision.datasetsimportMNIST 9fromtorchvision.transformsimportCompose,Normalize,ToTensor 10 11# Location in which to store downloaded data 12data_dir="../Data" 13 14# I used torch.std_mean to find the values given to Normalize 15# We will discuss normalization in section 4 16mnist_xforms=Compose([ToTensor(),Normalize((0.1307,),(0.3081,))]) 17 18# Load data files (training and validation partitions) 19train_data=MNIST(root=data_dir,train=True,download=True,transform=mnist_xforms) 20valid_data=MNIST(root=data_dir,train=False,download=True,transform=mnist_xforms) 21 22# Data loaders provide an easy interface for interactive with data 23train_loader=DataLoader(train_data,batch_size=len(train_data)) 24valid_loader=DataLoader(valid_data,batch_size=len(valid_data)) 25 26# This odd bit of code forces the train loader to give us all inputs and targets 27X_train, y_train=next(iter(train_loader)) 28X_valid, y_valid=next(iter(valid_loader)) 29 30# Let's get the average for each digit based on all training examples 31digit_averages={} 32fordigitinrange(10): 33digit_averages[digit]=X_train[y_train==digit].mean(dim=0).squeeze() 34 35 36# Next up we need to compare "unknown" images to our average images 37defget_most_similar(image:torch.Tensor,averages:dict): 38"""Compare the image to each of the averaged images. 39 40 Args: 41 image (torch.Tensor): an image represented as a tensor 42 averages (dict): a dictionary of averaged images 43 44 Returns: 45 the most similar label 46""" 47closest_label=None 48closest_distance=inf 49forlabelinaverages: 50distance=(image-averages[label]).abs().mean() 51ifdistance<closest_distance: 52closest_label=label 53closest_distance=distance 54returnclosest_label 55 56 57# Now we can get the most similar label for each validation image 58num_correct=0 59forimage,labelinzip(X_valid,y_valid): 60num_correct+=label==get_most_similar(image,digit_averages) 61 62print(f"Percent guessed correctly: {num_correct/len(X_valid)*100:.2f}%")
Question: Take a guess at the accuracy our
similarity-based model.
Answer: This model is correct about 66.85% of the time.
4 Single
Neuron
A single neuron in the brain is an incredibly complex machine that
even today we don’t understand. A single “neuron” in a neural network is
an incredibly simple mathematical function that captures a minuscule
fraction of the complexity of a biological neuron.
When our model is a single neuron we can only produce a single
output. So, \(n_y=1\) for this section.
Sticking to our MNSIT digits example from above, we could train a single
neuron to distinguish between two different classes of digits (e.g., “1”
vs “7”, “0” vs “non-zero”, etc.).
4.1
Notation and Diagram
Here is a diagram representing a single neuron (as we’ll see later,
some neural networks are just many of these neurons interconnected):
A neuron model with separate nodes for
linear and activation computations.
The diagram represents the following equations (note that I removed
the parenthesis superscript from the diagram to make it a bit easier to
read):
\(x_k\i\) are the input features
for the \(i^{th}\) example (e.g., \(k=76\) and \(i=7436\) would denote pixel 76 of 784 for
image 7436 of 60000)
\(w_k\) (weights) and \(b\) (bias) are the learned
parameters
\(z\i\) is a weighted sum of the
input features plus the additional bias term
\(a\i\) is the output of a
non-linear activation function \(g(\mathord{\cdot})\) applied to \(z\i\)
\(\yhat\i\) (pronounced “y
hat”) is the label we often give to the output (\(a\i = \yhat\i\))
Question: Why do \(w_k\) and \(b\) not have superscripts?
Answer: The parameters \(w_k\) and \(b\) do not change as the input \(x_k\i\) changes. These parameters
are the neuron, and they are used to produce the output
\(\yhat\i\) for any given input; we use
the same parameter values regardless of input.
For this model, we want to find parameters \(w_k\) and \(b\) such that the neuron outputs \(\yhat\i \approx y\i\) for any
input. Before we discuss optimization we should take a moment
to code up this single neuron model.
(Below is a more common representation of a neuron model. The image
above separates the linear and activation components into distinct
nodes, but it is more common to show them together as below.)
A neuron model.
4.2
Neuron with Python Standard Libraries
This code does not include any “learning” (i.e.,
optimization), but it is worth showing just how simple it is to write a
single neuron from scratch. Most of the code below is necessary only to
create some faked input data.
1#!/usr/bin/env python 2 3frommathimportexp 4fromrandomimportgauss 5 6 7defsigmoid(z:float)->float: 8"""The sigmoid/logistic activation function.""" 9return1/(1+exp(-z)) 10 11 12# The number of examples in our dataset 13N=100 14 15# Randomly generate some input data 16nx=4 17x1=[gauss(0,1)for_inrange(N)] 18x2=[gauss(0,1)for_inrange(N)] 19x3=[gauss(0,1)for_inrange(N)] 20x4=[gauss(0,1)for_inrange(N)] 21 22# Generate random neuron parameters 23w1=gauss(0,1) 24w2=gauss(0,1) 25w3=gauss(0,1) 26w4=gauss(0,1) 27b=0 28 29# Compute neuron output for each of the N examples 30forx1i,x2i,x3i,x4iinzip(x1,x2,x3,x4): 31zi=w1*x1i+w2*x2i+w3*x3i+w4*x4i+b 32ai=sigmoid(zi)
In this code listing I use the sigmoid activation
function (when not using a specific activation function we use \(g(\mathord{\cdot})\) in most equations).
This function is plotted below.
Sigmoid activation function and its
derivative.
Some nice properties of this function include:
An output range of [0, 1] (all inputs are “squashed” into this
range).
An easy to compute derivative.
Easy to interpret and understand.
Well-known.
We often use sigmoid activation functions for binary classification
(i.e., models trained to predict whether an input belongs to one of two
classes). If the output is \(≤0.5\) we
say the neuron predicts class \(A\)
otherwise class \(B\).
Question: Can you think of any downsides for this
function (hint: look at the derivative curve)?
Answer: While this function was once widely used, it
has fallen out of favor because it can often lead to slower learning due
to small derivative values for any input \(z\) outside of the range [-4, 4]. ReLU
is a more commonly used activation function for hidden layer neurons.
4.3 The
Dot-Product
We compute \(z\i\) using a
summation, but we can express this same bit of math using the
dot-product from linear algebra.
\[
z\i = \sum_{k=1}^{n_x} x_k\i w_k + b = \vx^{(i)T} \vw + b
\]
The \(\vx^{(i)T} \vw\) part of the
equation computes the dot-product between \(\vx^{(i)T}\) and \(\vw\). We need to transpose \(\vx\i\) to make the dimensions work (i.e.,
we need to multiply a row vector by a column vector).
This not only turns out to be easier to write/type, but it is more
efficiently computed by a neural network library. The code listing below
uses PyTorch to compute \(z\i\) (zi). Libraries like
PyTorch and Tensorflow make use of both vectorized CPU instructions and
graphics cards (GPUs) to quickly compute the output of matrix
multiplications.
1 │ 1 │#!/usr/bin/env python 2 │ 2 │ 3 ││from math import exp 4 ││from random import gauss 5 ││ 6 ││ 7 ││defsigmoid(z: float) -> float: 8 ││"""The sigmoid/logistic activation function.""" 9 ││return1/ (1+ exp(-z))│ 3 │import torch 10 │ 4 │ 11 │ 5 │ 12 │ 6 │# The number of examples in our dataset 14 │ 8 │ 15 │ 9 │# Randomly generate some input data 16 │ 10 │nx =4 17 ││x1 = [gauss(0, 1) for_inrange(N)] 18 ││x2 = [gauss(0, 1) for_inrange(N)] 19 ││x3 = [gauss(0, 1) for_inrange(N)] 20 ││x4 = [gauss(0, 1) for_inrange(N)]│ 11 │X = torch.randn(N, nx) 21 │ 12 │ 22 │ 13 │# Generate random neuron parameters 23 ││w1 = gauss(0, 1) 24 ││w2 = gauss(0, 1) 25 ││w3 = gauss(0, 1) 26 ││w4 = gauss(0, 1)│ 14 │w = torch.randn(nx) 27 │ 15 │b =0 28 │ 16 │ 29 │ 17 │# Compute neuron output for each of the N examples 30 ││for x1i, x2i, x3i, x4i inzip(x1, x2, x3, x4): 31 ││ zi = w1 * x1i + w2 * x2i + w3 * x3i + w4 * x4i + b 32 ││ ai = sigmoid(zi)│ 18 │for xi in X:│ 19 │ zi = xi @ w + b│ 20 │ ai =torch.sigmoid(zi)
The code snippet above shows a diff between the previous
code snippet and an updated one using the dot product. You will see many
diffs throughout this document. The key points are that: (1) red
indicates text or entire lines that have been removed and (2) green
indicates updated or newly added lines.
We do not need to transpose xi in code because when we
iteration through X we get row vectors. As it happens, we
can improve efficiency even further.
4.4
Vectorizing Inputs
In addition to using a dot-product in place of a summation, we can
use a matrix multiplication in place of looping over all examples in the
dataset. In the two equations below we perform a matrix multiplication
that computes the output of the network for all examples at once. A
neural network library can turn this into highly efficient CPU or GPU
operations.
\[\begin{align}
\vz &= X \vw + \mathbf{1} b \\
\va &= g(\vz)
\end{align}\]
15 │ 15 │b =0 16 │ 16 │ 17 │ 17 │# Compute neuron output for each of the N examples 18 ││for xi in X: 19 ││ zi =xi@ w + b 20 ││ ai = torch.sigmoid(zi)│ 18 │z =X@ w + b│ 19 │yhat = torch.sigmoid(z)
Question: What are the dimensions of \(\vz\) and \(\va\) (aka, \(\vyhat\))?
Answer: We are computing a single output value for
each input, so, the shape of these vectors are \((N \times 1)\). PyTorch will treat these as
arrays with \(N\) elements instead of
as column vectors. \[\begin{align}
\vz &=
\begin{bmatrix}
\vx^{(1)T} \vw + b \\
\vx^{(2)T} \vw + b \\
\vdots \\
\vx^{(N)T} \vw + b \\
\end{bmatrix}
\\
\va &=
\begin{bmatrix}
g(z^{(1)}) \\
g(z^{(2)}) \\
\vdots \\
g(z^{(N)}) \\
\end{bmatrix}
\end{align}\]
In the code snippet above, a matrix multiplication is indicated in
PyTorch using the @ symbol (a * is used for
element-wise multiplications). A key to understanding matrix math is to
examine the shapes of all matrices involved. Above, \(X\) has a shape of \((N \times n_x)\), \(\vw\) has a shape of \((n_x \times 1)\), and \(b\) is a scalar multiplied by an
appropriately-shaped matrix of all ones (so that we can add \(b\) to each element of the \(X\vw\) result). Inner dimensions (the last
dimension of the left matrix and the first dimension of the right
matrix) must be the same for any valid matrix multiplication.
In the code snippet, the scalar \(b\) is added element-wise to every element
in the final matrix due to broadcasting
(this is a common library feature, not necessarily standard linear
algebra).
So far, we have random parameters and we ignore the output. But what
if we want to train the neuron so that the output mimics a real function
or process? The next subsection tackles this very problem.
4.5
Optimization with Batch Gradient Descent
We must find values for parameters \(\vw\) and \(b\) to make \(\yhat\i \approx y\i\). As you might expect
from the title of this subsection, we are going to use gradient descent
to optimize the parameters. This means that we are going to need an
objective function (something to minimize) and to compute some
derivatives.
But what is an appropriate objective function (I’ll refer to this as
the loss function going forward)? How about the
mean-difference?
\[ℒ(\vyhat, \vy) = \sum_{i=1}^N (\yhat\i -
y\i) \quad \color{red}{\text{Don't use this loss
function.}}\]
Question: What is problematic about this loss function?
Answer:
Let’s start by looking at the output of the function for different
values of the inputs.
\(\yhat\i\)
\(y\i\)
ℒ
0.1
0
0.1
0.1
1
-0.9
0.9
0
0.9
0.9
1
-0.1
The table indicates that loss can be positive or negative. But how
should we interpret negative loss? We see that \(ℒ\) is minimized in row 2 of the table, but
this is not an ideal result. The sign of loss is not helpful—as we’ll
see shortly, we will use the sign of the derivative.
A quick “fix” for the above loss function is to change it into the
mean-absolute-error (MAE):
The second line shows a vectorized version using the L1-norm, which
is the sum of the absolute values of the given vector. MAE is a good
choice if your dataset includes outliers. MAE is also simple to
interpret: it is the average deviation between your models guess and the
correct answer.
A common choice for a loss function when training a regression model
is Half mean-square-error (Half-MSE):
We are again using the L1-norm, but this time the vector we are
norming is the element-wise squared values of the difference between the
vectors \(\vyhat\) and \(\vy\). Interpreting Half-MSE is a bit
harder than MAE—you should multiply the result by two and then take the
square-root.
Question: Why might we compute the half-MSE instead of
MSE or sum-square-error (SSE)?
Answer: The factor cancels out when we take the
derivative. This scaling factor is unimportant since we will later
multiply it by a learning rate, and can use that to achieve whatever
effect we want.
The standard choice when performing classification with a neuron is
binary cross-entropy (BCE):
In the vectorized version of BCE, I’ve used the non-standard \(\text{mean}_0\) notation to indicate that
we’re taking the average across the rows, dimension zero. This is closer
to the code that you’ll actually write. Very rarely will you want to put
a summation loop in your code.
Question: Take some time to examine this loss function.
What happens for various values of \(\yhat\i\), \(y\i\)?
Answer:
\(\yhat\i\)
\(y\i\)
\(\log{\yhat\i}\)
\(\log{(1-\yhat\i)}\)
ℒ
0.1
0
-2.3
-0.1
0.1
0.1
1
-2.3
-0.1
2.3
0.9
0
-0.1
-2.3
2.3
0.9
1
-0.1
-2.3
0.1
The tables shows that a larger difference between \(\yhat\i\) and \(y\i\) (rows 2 and 3) results in a larger
loss, which is exactly what we’d like to see.
Let’s move forward using binary cross-entropy loss and the sigmoid
activation function.
We can only reduce loss by adjusting parameters. It doesn’t make
sense, for example, to minimize loss by changing the input values \(X\) or the output targets \(Y\). Take a look at the following
fictitious loss landscape.
The effect on loss \(ℒ\) of adjusting parameter \(w_k\).
The diagram above shows a curve for loss as a function of a single
parameter, \(w_k\). For this figure,
we’ll momentarily ignore that we might have dozens (or thousands or
millions) of parameters. We want to find a new value for \(w_k\) such that loss is reduced. You might
wonder why I said “loss is reduced” instead of “loss is minimized.” You
might be familiar with techniques for finding an exact
answer using an analytical (aka closed-form) solution.
Question: What should we do if we wanted to
minimize loss with respect to the parameter using an
analytical solution?
Answer: We should take the derivative, set it equal
to zero, and then solve the set of linear equations. Here is an example
using linear regression, which is very similar to our single neuron.
Here is our model:
\[\vyhat = X \mathbf{θ},\]
where \(θ\) is our vector of
parameters. Here is our loss function (half-SSE):
And now assuming that \(X^T X\) is
invertible (that the columns are linearly independent).
\[\mathbf{θ}^* = (X^T X)^{-1} X^T
\vy\]
We now have an optimal solution (called \(\mathbf{θ}^*\)) that minimizes loss. (See
Ordinary least squares -
Wikipedia for more details.)
For complex models, such as a neural network, analytical solutions
are sometimes too slow or complicated to compute. Instead, we use an
iterative (aka numerical) solution. You can think of numerical solutions
as finding a good enough approximate solution as opposed to the exact
correct solution. Surprisingly, the numerical solution is often more
general than the exact solution—we’ll discuss this in later
sections.
To determine how we should adjust parameters, we
start the same way as finding the exact location and take the partial
derivative of loss with respect to each parameter. Taking the single
neuron, binary cross-entropy loss, and the sigmoid activation function
the chain rule in matrix form is as follows.
Don’t worry too much about the derivations or notation at this stage.
We’ll go into more details when we follow the same process for a full
neural network in the next section.
Question: Why is it necessary to apply the chain rule?
And why did the chain rule appear as it does above?
Answer: First, we cannot directly compute the
partial derivative of \(ℒ\) with
respect to \(\vw\) (or \(b\)). Second, we only apply the chain rule
to equations that have some form of dependency on the term in the first
denominator (\(\vw\) and \(b\)). It is useful to look at the loss
function when we substitute in values for \(\yhat\) and then \(z\).
In the above equation we can more easily see how the chain-rule comes
into play. The parameter \(\vw\) is
nested within a call to \(σ\) which is
nested within a call to \(\log\) when
computing \(\frac{∂ ℒ}{∂ \vw}\).
Question: What do we do with the partial derivatives
\(\frac{∂ ℒ}{∂ \vw}\) and \(\frac{∂ ℒ}{∂ b}\)?
Answer: We use these terms to update model
parameters.
\[\begin{align}
\vw &:= \vw - η \frac{∂ ℒ}{∂ \vw} \\
b &:= b - η \frac{∂ ℒ}{∂ b}
\end{align}\]
Question: What is the derivative of the sigmoid
function, \(σ\)?
With the two update equations shown in the previous answer we have
everything we need to train our neuron model. Looking at these two
equations you might wonder about the purpose of \(η\) (i.e., the “learning rate”). This
factor enables us to tune how fast or slow we learn. If \(η\) is set too high we might not be able to
learn, and it it is set too low we might learn prohibitively slowly. We
will go into more details on optimization in sec. 7.
4.6
Neuron Batch Gradient Descent
Here is a complete example in which we train a neuron to classify
images as either being of the digit 1 or the digit 7. Data processing
details are hidden in the get_binary_mnist_one_batch
function, but you can find that code
in the repository for this guide.
1#!/usr/bin/env python 2 3fromutilitiesimportget_binary_mnist_one_batch,format_duration_with_prefix 4fromtimeitimportdefault_timerastimer 5importtorch 6 7 8defcompute_accuracy(yhat,y): 9valid_N=y.shape[0] 10return1-(torch.round(yhat)-y).abs().sum()/valid_N 11 12 13# Get training and validation data loaders for classes A and B 14data_dir="../../Data" 15classA, classB=1, 7 16flatten=True 17train_X, train_y, valid_X, valid_y=get_binary_mnist_one_batch( 18data_dir,classA,classB,flatten 19) 20 21# Neuron parameters 22nx=28*28 23w=torch.randn(nx)*0.01 24b=torch.zeros(1) 25 26# Batch gradient descent hyper-parameters 27num_epochs=4 28learning_rate=0.01 29 30# Compute initial accuracy (should be around 50%) 31valid_yhat=torch.sigmoid(valid_X@w+b) 32valid_accuracy=compute_accuracy(valid_yhat,valid_y) 33print(f"Accuracy before training: {valid_accuracy:.2f}") 34 35# Learn values for w and b that minimize loss 36forepochinrange(num_epochs): 37 38start=timer() 39 40# Make predictions given current paramters and then compute loss 41yhat=torch.sigmoid(train_X@w+b) 42losses=-(train_y*torch.log(yhat)+(1-train_y)*torch.log(1-yhat)) 43 44# Compute derivatives for w and b (dz is common to both derivatives) 45dz=yhat-train_y 46dw=(1/train_y.shape[0])*(dz@train_X) 47db=dz.mean() 48 49# Update parameters 50w-=learning_rate*dw 51b-=learning_rate*db 52 53# Report on progress 54valid_yhat=torch.sigmoid(valid_X@w+b) 55valid_accuracy=compute_accuracy(valid_yhat,valid_y) 56 57info=f"{epoch+1:>2}/{num_epochs}" 58info+=f", Loss={losses.mean():0.1f}" 59info+=f", Accuracy={valid_accuracy:.2f}" 60info+=f", Time={format_duration_with_prefix(timer()-start)}" 61print(info)
Question: Which lines of code correspond to \(\frac{∂ ℒ}{∂ \vw}\) and \(\frac{∂ ℒ}{∂ b}\)?
Answer: Lines 46 and 47.
Question: What is an epoch?
Answer: It turns out that we might need to update our
weights more than once to get useful results. Each time we update
parameters based on all training examples we mark the end of an epoch.
In the code above we iterate through four epochs.
Question: What do you expect to see for the output?
Answer:
Accuracy before training: 0.54
 1/4, Loss=0.7, Accuracy=0.97, Time=5.5 ms
 2/4, Loss=0.5, Accuracy=0.96, Time=4.8 ms
 3/4, Loss=0.4, Accuracy=0.96, Time=4.6 ms
 4/4, Loss=0.3, Accuracy=0.96, Time=4.4 ms
5 Neural
Networks and Backpropagation
Once your computer is pretending to be a neural net, you get it to be
able to do a particular task by just showing it a whole lot of
examples.
– Geoffrey Hinton
Below is our first neural network (aka multi-layer perceptron, MLP).
We’ll start by using this diagram to formulate terminology and
conventions.
A two-layer neural network.
Notation:
Layer 0 is the input (we called this \(X\) for a single Neuron)
Square bracket superscripts denote the network layer
Round parenthesis superscripts denote the example index
\(w\) parameter subscripts denote
first the associated neuron in the current layer and second the
associated neuron (or input) from the previous layer
\(b\), \(z\), and \(a\) subscripts denote an associated
neuron
Notice how we have all the same components as we did for the single
neuron. We’ve just added additional notation to distinguish among layers
and neurons in the same layer.
Question: Given some hypothetical deep neural network,
how would you denote the linear computation of the third neuron in the
fifth layer for training example 6123?
Answer:\[z_3^{[5](6123)}\]
“\(z\)”: linear computation
“\([5]\)” superscript: fifth
layer
“\((6123)\)” superscript: example
6123
“\(3\)” subscript: third
neuron
5.1
Vectorized Equations For a Neural Network
Let’s start with showing the notation for parameters from any layer
\(l = 1, 2, ..., L\) where \(L\) is the number of layers in the
network.
Compare these equations to the diagram above. Notice how the top
neuron in layer 1 would have its associated parameters in the first row
of \(W^{[1]}\) and the first value in
\(\vb^{[1]}\).
Next we have the vectorized linear and activation equations for each
neuron in a layer (these are for all training examples):
We compute this matrix by multiplying a \((N \times n_{l-1})\) matrix by a \((n_{l-1}, n_l)\) matrix (the transposed
parameter matrix) and adding an \((N \times
n_l)\) matrix.
You should also think about the shapes of \(\va^{[l-1](i)}\) and \(\vw_{j}^{[l]}\).
5.2
Backpropagation
Just like for the single neuron, we want to find values for \(W^{[l]}\) and \(\vb^{[l]}\) (for \(l = 1, 2, ..., L\)) such that \(A^{[L]} \approx Y\) (\(A^{[L]}\) is another name for \(\hat Y\)). Instead of looking at a more
general case, let’s work through gradient descent for the two-layer
network above where we
have three inputs (\(n_x=n_0=3\)),
have two neurons in layer 1 (\(n_1=2\)),
have three neurons in layer 2 (\(n_y=n_2=3\)),
are using sigmoid activations for all neurons, and
are using the binary-cross-entropy (BCE) loss function.
You can imagine that we are performing multi-label classification.
For this network, we need to compute these partial derivatives:
We are going to start at layer 2 and work backward through the
network to layer 1. As we compute these derivatives answer for yourself
“why do we work backward through the network?”
This process of computing derivatives backward through the network is
why this process if referred to as backpropagation–we’ll compute values
and propagate them backward to earlier layers in the network. This is
easier to see when viewing the compute graph. A compute graph depicts
the flow of activations (during the forward pass) and gradients (during
the backward pass) through the network.
Compute graph for two-layer
network.
Notice how the input flows forward from top-to-bottom in the compute
graph, but gradients flow backward (from bottom-to-top). This image
corresponds to the network above if you rotate it 90 degrees
anti-clockwise (mostly just so we I had space for the image on this
page).
5.2.1
Layer 2 Parameters
Let’s start with the terms labeled ③ and ④ above, which correspond to
layer 2. The chain-rule requires us to derive three components.
These equations share the first two terms. In fact, we’ll see these
again for the first layer; so, it makes sense to give them their own
symbol, \(∂_{Z^{[2]}}=\textcolor{blue}{{\frac{∂ ℒ}{∂
A^{[2]}}}}\textcolor{green}{\frac{∂ A^{[2]}}{∂ Z^{[2]}}}\). (You
might notice that I am leaving out the \(\text{mean}_0\) operation from BCE; this is
intentional as it will be handled below using a matrix multiplication
for one of the partial derivatives below.)
All four derivations share the first two terms in common, \(∂_{Z^{[2]}}\). The first layer parameters
additional share the next two terms. We’ll group the first four terms
together just like we did for layer 2: \(∂_{Z^{[1]}}=∂_{Z^{[2]}}\textcolor{cyan}{\frac{∂
Z^{[2]}}{∂ A^{[1]}}}\textcolor{lime}{\frac{∂ A^{[1]}}{∂
Z^{[1]}}}\).
Let’s agree we should avoid computing those derivatives by hand. The
process is time consuming and error prone. Instead let’s rely on a
technique known as automatic differentiation, which is built-in
to PyTorch and most machine learning frameworks.
An automatic differentiation library:
Creates a compute graph from your tensor operations.
Performs a topological sort on the compute graph.
Compute gradients and back propagates them to all matrices.
Two key points from the listing above, (1)
requires_grad=True tells PyTorch to create the compute
graph and compute partial derivatives with respect to the given tensor,
and (2) I’ve ensured that each line of code contains a single operation,
which makes it easier to match with the diagram below (I’ve provided
this one in a bit more detail).
Compute graph for two-layer
network.
This diagram is (often) constructed dynamically as operations are
performed. Edges indicate the flow of gradients in the backward
direction. We start at graph source nodes (e.g., the “loss” node) and
compute partial derivatives with respect to their inputs until we reach
graph sinks (e.g., parameters). This diagram (and the corresponding
code) map directly to the hand-computed derivatives from the previous
section. Take some time and see if you can see how they map to one
another.
If you’d like to see how an automatic differentiation
library is coded, please take a look at my simple Match library, which
tries to closely mimic the PyTorch interface.
5.4.1
Alternatives
In addition to the technique above known as reverse mode automatic
differentiation, you might also hear about
set hyperparameters (e.g., learning rate, number of epochs,
etc.),
create the model, and
train the model.
We’ve discussed each of these areas in general, but now we’ll go into
more details starting with the final step, training the model.
6.1
Batch Gradient Descent
All examples thus far have used batch gradient descent (BGD). All
gradient descent methods are iterative, meaning we continually make
small changes to the parameters until we are satisfied or run out of
time. BGD looks something like this:
for each epoch
    1. compute gradient with respect to all examples
    2. average gradients across all examples
    3. update parameters using averaged gradients
In all variants of gradient descent, an epoch refers to the process
by which we update the parameters with respect to all training examples.
In batch gradient descent, we compute all gradients at once and average
them across all examples, resulting in the parameters being updated a
single time each epoch. This has the advantage of smoothing out the
affect of any outliers and leveraging the parallel nature of modern CPUs
and GPUs. On the other hand, it can be a waste of resources (mainly
time) to only update the parameters once each epoch.
6.2
Stochastic Gradient Descent
In stochastic Gradient Descent (SGD) we update parameter \(N\) times per epoch—once per example. This
means that we update parameters more frequently than in BGD.
The stochastic part of SGD refers to a random
shuffling of the example each epoch. This tends to reduce loss “cycling”
where some sequence of repeated example increases and then decreases
loss.
for each epoch
    randomly shuffle all examples
    for each example
        1. compute gradient with respect to single example
        2. update parameters using gradient
Although we update the parameters more frequently, not all updates
are good. Outliers will make the model perform worse in the
general case. Moreover, SGD does not take advantage of parallel
computations.
6.3
Mini-Batch Stochastic Gradient Descent
Mini-Batch SGD provides a middle ground. We chunk the input into some
number of batches and take the average gradient over each batch.
for each epoch
    randomly distribute examples into batches
    for each batch
        1. compute gradient with respect to all examples in batch
        2. average gradients across all examples in batch
        3. update parameters using averaged gradients
This enables us to get the best of both worlds:
less susceptible to outliers and noise,
a good number of updates per epoch, and
good utilization of computing resources.
Question: What batch size turns Mini-Batch SGD into
BGD? What batch size turns Mini-Batch SGD into SGD?
Answer:\(N\) and
\(1\), respectively.
Question: Will all batches be the same size?
Answer: No. The last batch is frequently smaller than
all other batches. It contains the leftovers.
The code-diff below shows how few changes are needed to convert our
BGD example into Mini-Batch SGD.
7
Optimization Techniques
7.1
Momentum
7.1.1
Nesterov’s Accelerated Gradients
7.2
RMSProp
7.3
Adam
7.4
AMSGrad
8
Overfitting and Generalization
Being revised
9
Convolutional Neural Networks
Being revised
10
Recurrent Neural Networks
Being revised
11
Attention and Transformers
Being revised
12
Advanced Topics
Being revised
Terminology
Machine Learning
Artificial Intelligence (AI): computer systems that are
capable of completing tasks that typically require a human. This is a
moving bar–as something becomes easier for a computer, we tend to stop
considering it as AI (how long until deep learning is not AI?).
Machine Learning (ML): learn a predictive model from data
(e.g., deep learning and random forests). ML is related to data mining
and pattern recognition.
Deep Learning (DL): learn a neural network model with two or
more hidden layers.
Supervised Learning: learn a mapping from input features to
output values using labeled examples (e.g., image classification).
Unsupervised Learning: extract relationships among data
examples (e.g., clustering).
Reinforcement Learning (RL): learn a model that maximizes
rewards provided by the environment (or minimize penalties).
Hybrid Learning: combine methods from supervised,
unsupervised, and reinforcement learning (e.g., semi-supervised
learning).
Classification: given a set of input features, produce a
discrete output value (e.g., predict whether a written review is
negative, neutral, or positive).
Regression: given a set of input features, produce a
continuous output value (e.g., predict the price of a house from the
square footage, location, etc.).
Clustering: a grouping of input examples such that those
that are most similar are in the same group.
Model: (predictor, prediction function, hypothesis,
classifier) a model along with its parameters.
Example: (instance, sample, observation, training pair) an
input training/validation/testing input (along with its label in the
case of supervised learning).
Input: (features, feature vector, attributes, covariates,
independent variables) values used to make predictions.
Channel: subset of an input–typically refers to the red,
green, or blue values of an image.
Output: (label, dependent variable, class, prediction) a
prediction provided by the model.
Linear Separability: two sets of inputs can be divided a
hyperplane (a line in the case of two dimensions). This is the easiest
case for learning a binary classification.
Parameter: (weights and biases, beta, etc.) any model values
that are learned during training.
Hyperparameter (learning rate, number of epochs,
architecture, etc.): any value that affects training results but is not
directly learned during training.
Neural Network Terms
Neural Network (NN): (multi-layer perceptron (MLP),
artificial NN (ANN)) a machine learning model (very loosely) based on
biological nervous systems.
Perceptron: a single layer, binary classification NN (only
capable of learning linearly separable patterns).
Neuron: (node) a single unit of computation in a NN. A
neuron typically refers to a linear (affine) computation followed by a
nonlinear activation.
Layer: many NNs are simply a sequence of layers, where each
layer contains some number of neurons.
Input Layer: the input features of a NN (the first “layer”).
These can be the raw values or scaled values–we typically normalize
inputs or scale them to either [0, 1] or [-1, 1].
Hidden Layer: a NN layer for which we do not directly
observe the values during inference (all layers that are not an input or
output layer).
Output Layer: the final layer of a NN. The output of this
layer is (are) the prediction(s).
Architecture: a specific instance of a NN, where the types
of neurons and connectivity of those neurons are specified (e.g., VGG16,
ResNet34, etc.). The architecture sometimes includes optimization
techniques such as batch normalization.
Forward Propagation: the process of computing the output
from the input.
Training: the process of learning model parameters.
Inference: (deployment, application) the process of using a
trained model.
Dataset: (training, validation/development, testing) a set
of data used for training a model. Typically a dataset is split into a
set used for training (the training set), a set for computing metrics
(the validation/development set), and a set for evaluation (the testing
set).
Convolutional Neural Network (CNN): a NN using convolutional
filters. These are best suited for problems where the input features
have geometric properties–mainly images (see 3D Visualization of
a Convolutional Neural Network).
Filter: a convolution filter is a matrix that can be used to
detect features in an image; they will normally produce a
two-dimensional output (see Image Kernels Explained
Visually, Convolution
Visualizer, and Receptive
Field Calculator). Filters will typically have a kernel size,
padding size, dilation amount, and stride.
Pooling: (average-pooling, max-pooling, pooling layer) a
pooling layer is typically used to reduce the size of a filter
output.
Autoencoder: a common type of NN used to learn new or
compressed representations.
Recurrent Neural Network (RNN): A NN where neurons can
maintain an internal state or backward connections and exhibit with
temporal dynamics. One type of RNN is a recursive
neural network.
Loss: (loss function) a function that we minimize during
learning. We take the gradient of loss with respect to each parameter
and then move down the slope. Loss is frequently defined as the error
for a single example in supervised learning.
Cost: (cost function) similar to loss, this is a function
that we try to minimize. Cost is frequently defined as the sum of loss
for all examples.
Generalization: how well a model extrapolates to unseen
data.
Overfitting: how much the model has memorized
characteristics of the training input (instead of generalizing).
Regularization: a set of methods meant to prevent
overfitting. Regularization reduces overfitting by shrinking parameter
values (larger parameters typically means more overfitting).
Bias: when a model has larger-than-expected training and
validation loss.
Variance: when model has a much larger validation error
compared to the training error (also an indication of overfitting).
Uncertainty: some models can estimate a confidence in a
given prediction.
Embedding: a vector representation of a discrete variable
(e.g., a method for representing an English language word as an input
feature).
Activation Terms
Affine: (affine layer, affine transformation) the
combination of a linear transformation and a translation (this results
in a linear transformation).
Nonlinear: a function for which the change in the output is
not proportional to the change in the input.
Sigmoid: (sigmoid curve, logistic curve/function) a common
activation function that is mostly used in the output layer of a binary
classifier. Gradient is small whenever the input value is too far from
0.
Sigmoid Activation Function
Hyperbolic Tangent: (tanh) another (formerly) common
activation funtcion (better than sigmoid, but typically worse than
ReLu). Gradient is small whenever the input value is too far from
zero.
Hyperbolic Tangent Activation
Function
ReLU: (rectified linear unit, rectifier) the most widely
used activation function.
ReLU Activation Function
Leaky ReLU: a slightly modified version of ReLU where there
is a non-zero derivative when the input is less than zero.
Leaky ReLU Activation
Function
Softmax: (softmax function, softargmax, log loss) is a
standard activation function for the last layer of a multi-class NN
classifier. It turns the outputs of several nodes into a probability
distribution (see The
Softmax function and its derivative).
Learning Techniques
Data Augmentation: the process of altering inputs each epoch
thereby increasing the effective training set size.
Transfer Learning: use a trained model (or part of it) on an
input from a different distribution. Most frequently this also involve
fine-tuning.
Fine-tuning: training/learning only a subset of all
parameters (usually only those nearest the output layer).
Dropout: a regularization technique in which neurons are
randomly zeroed out during training.
Batch Normalization: is a technique that speeds up training
by normalizing the values of hidden layers across input batches.
Normalizing hidden neuron values will keep derivatives higher on
average.
Gradient Descent (GD): (batch GD (BGD), stochastic GD (SGD),
mini-batch GD) a first-order optimization algorithm that can be used to
learn parameters for a model.
Backpropagation: application of the calculus chain-rule for
NNs.
Learning Rate: a hyperparameter that adjusts the training
speed (too high will lead to divergence).
Vanishing Gradients: an issue for deeper NNs where gradients
saturate (becomes close to zero) and training is effectively
halted.
Exploding Gradients: an issue for deeper NNs where gradients
accumulate and result in large updates causing gradient descent to
diverge.
Batch: a subset of the input dataset used to update the NN
parameters (as opposed to using the entire input dataset at once).
Epoch: each time a NN is updated using all inputs (whether
all at once or using all batches).
Momentum: an SGD add-on that speeds up training when
derivatives stay the same sign each update.